Here's What Whitehaven Coal Limited's (ASX:WHC) P/E Ratio Is Telling Us

This article is for investors who would like to improve their understanding of price to earnings ratios (P/E ratios). We'll look at Whitehaven Coal Limited's (ASX:WHC) P/E ratio and reflect on what it tells us about the company's share price. Whitehaven Coal has a P/E ratio of 5.93, based on the last twelve months. In other words, at today's prices, investors are paying A$5.93 for every A$1 in prior year profit.
See our latest analysis for Whitehaven Coal
How Do You Calculate A P/E Ratio?
The formula for P/E is:
Price to Earnings Ratio = Share Price ÷ Earnings per Share (EPS)
Or for Whitehaven Coal:
P/E of 5.93 = A$3.17 ÷ A$0.53 (Based on the trailing twelve months to June 2019.)
Is A High Price-to-Earnings Ratio Good?
The higher the P/E ratio, the higher the price tag of a business, relative to its trailing earnings. That isn't necessarily good or bad, but a high P/E implies relatively high expectations of what a company can achieve in the future.
How Does Whitehaven Coal's P/E Ratio Compare To Its Peers?
We can get an indication of market expectations by looking at the P/E ratio. The image below shows that Whitehaven Coal has a lower P/E than the average (7.2) P/E for companies in the oil and gas industry.
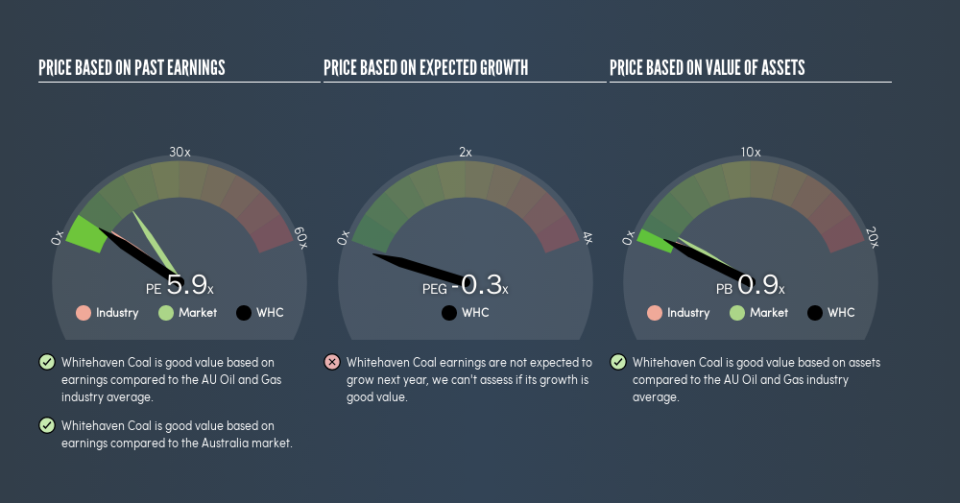
This suggests that market participants think Whitehaven Coal will underperform other companies in its industry. Since the market seems unimpressed with Whitehaven Coal, it's quite possible it could surprise on the upside. If you consider the stock interesting, further research is recommended. For example, I often monitor director buying and selling.
How Growth Rates Impact P/E Ratios
P/E ratios primarily reflect market expectations around earnings growth rates. If earnings are growing quickly, then the 'E' in the equation will increase faster than it would otherwise. Therefore, even if you pay a high multiple of earnings now, that multiple will become lower in the future. And as that P/E ratio drops, the company will look cheap, unless its share price increases.
Whitehaven Coal had pretty flat EPS growth in the last year. But EPS is up 196% over the last 3 years.
A Limitation: P/E Ratios Ignore Debt and Cash In The Bank
Don't forget that the P/E ratio considers market capitalization. That means it doesn't take debt or cash into account. The exact same company would hypothetically deserve a higher P/E ratio if it had a strong balance sheet, than if it had a weak one with lots of debt, because a cashed up company can spend on growth.
While growth expenditure doesn't always pay off, the point is that it is a good option to have; but one that the P/E ratio ignores.
How Does Whitehaven Coal's Debt Impact Its P/E Ratio?
Whitehaven Coal has net debt worth just 1.7% of its market capitalization. So it doesn't have as many options as it would with net cash, but its debt would not have much of an impact on its P/E ratio.
The Bottom Line On Whitehaven Coal's P/E Ratio
Whitehaven Coal trades on a P/E ratio of 5.9, which is below the AU market average of 15.8. EPS grew over the last twelve months, and debt levels are quite reasonable. If you believe growth will continue - or even increase - then the low P/E may signify opportunity.
When the market is wrong about a stock, it gives savvy investors an opportunity. If it is underestimating a company, investors can make money by buying and holding the shares until the market corrects itself. So this free report on the analyst consensus forecasts could help you make a master move on this stock.
Of course, you might find a fantastic investment by looking at a few good candidates. So take a peek at this free list of companies with modest (or no) debt, trading on a P/E below 20.
We aim to bring you long-term focused research analysis driven by fundamental data. Note that our analysis may not factor in the latest price-sensitive company announcements or qualitative material.
If you spot an error that warrants correction, please contact the editor at editorial-team@simplywallst.com. This article by Simply Wall St is general in nature. It does not constitute a recommendation to buy or sell any stock, and does not take account of your objectives, or your financial situation. Simply Wall St has no position in the stocks mentioned. Thank you for reading.
