Alabama’s third annual school report card grades are out, and the news is good. As was the case with the last round of grades, there are more A’s and B’s, with fewer C’s, D’s, and F’s statewide.
While wealthy suburban schools and urban magnet schools topped the list with the highest scores, there were plenty of A’s earned by rural schools and schools with more than half of their students struggling with the challenges of poverty.
Gov. Kay Ivey, who is also president of the state school board, acknowledged the success shown by improved school and district grades but said there is always more to do to improve student outcomes.
“We can all agree that every Alabama student deserves the best educational opportunities, and any growth and achievement should be celebrated,” she wrote in a statement to AL.com.
“Even while strides are being taken to improve Alabama’s education system," Ivey continued, “more must be done so that our students and our teachers have the best chance at success. Localized efforts are driving the progress we are seeing here, but it remains my goal to see that happening all across the state.”
Friday morning’s release marks the earliest grades have been released since the law requiring letter grades for schools and districts was enacted. The information in the report card covers both the 2018-19 and 2017-18 school years.
Critics of grading schools say education is too complicated to boil down to a single letter grade. Proponents say the single letter grade is something parents can easily understand.
The report cards mistakenly went online on Wednesday but were taken offline until the planned release Friday morning. They were online long enough for AL.com to get a good look, finding the statewide grade rose from 80 to 84, a solid 'B'.

Here’s a link to the state department’s report card website. It’s packed with new features, unveiled in August, to allow you to see a lot of information about a school in a user-friendly way, including data about teacher experience, certification, and the percentage of students who reached proficiency on state tests.
Alabama Superintendent Dr. Eric Mackey touted the new features in a press release accompanying the public release of the 2018-19 report card Friday morning.
“The new report card allows you to compare up to four schools and/or school systems side-byside, with applicable data available from 2014-2015, to the most current information available, 2017-2018,” Mackey said. “Previously, there were two separate documents that contained all the information the ALSDE is required to report for both state and federal mandates. Now, all the information for both are integrated into this one platform.”
Those proficiency levels form the basis of two of the six factors on the report card. Grades are awarded based on student outcomes—test scores, graduation rates, measures of college and career readiness, and the percentage of students who miss more than 15 days of school in a school year.
Statewide, A’s are up
The number of schools making A’s has nearly doubled since grades were first issued in the 2016-17 school year, while the number of schools making F’s has dropped dramatically, down to 23 from a high of 100 two years earlier.

The number of schools earning A's and B's continues to grow, according to the 2018-19 Alabama Education Report Card, released Oct. 18, 2019.
While academic achievement, growth, and rates of absenteeism are from the 2018-19 school year, graduation rates and college and career readiness rates are from the 2017-18 school year.
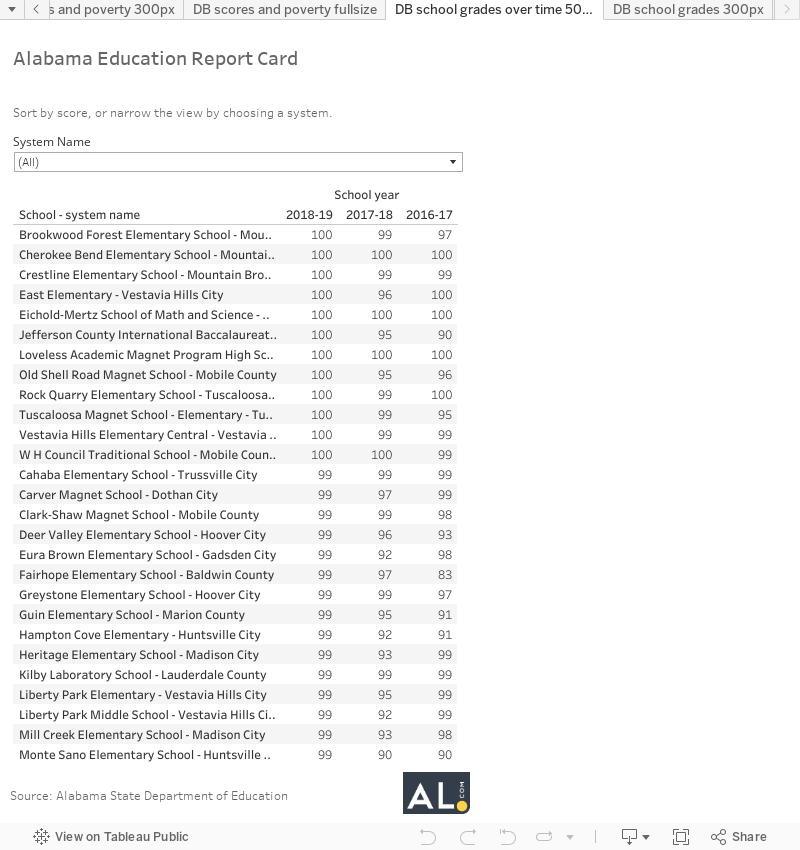
Twelve Alabama schools earned perfect scores of 100, up from four last year. Those perfect scores were earned by magnet schools and schools with low levels of student poverty.
In eight of Alabama’s 137 school districts, every school earned an 'A':
- Arab City – 4 schools,
- Auburn City – 13 schools,
- Cullman City – 5 schools,
- Homewood City – 5 schools,
- Madison City – 11 schools,
- Mountain Brook City – 6 schools,
- Trussville City – 5 schools,
- Vestavia Hills City – 8 schools
Most of the 23 schools earning F’s were in rural or urban areas. Birmingham had six schools earn F’s, up from five last year. Montgomery dropped from 13 schools earning F’s last year to six this year. In Huntsville City Schools, one school earned an ‘F,’ down from four last year.
Only one Alabama district, Barbour County, had all of its schools—there are three schools in the district—earn F’s on the report card.
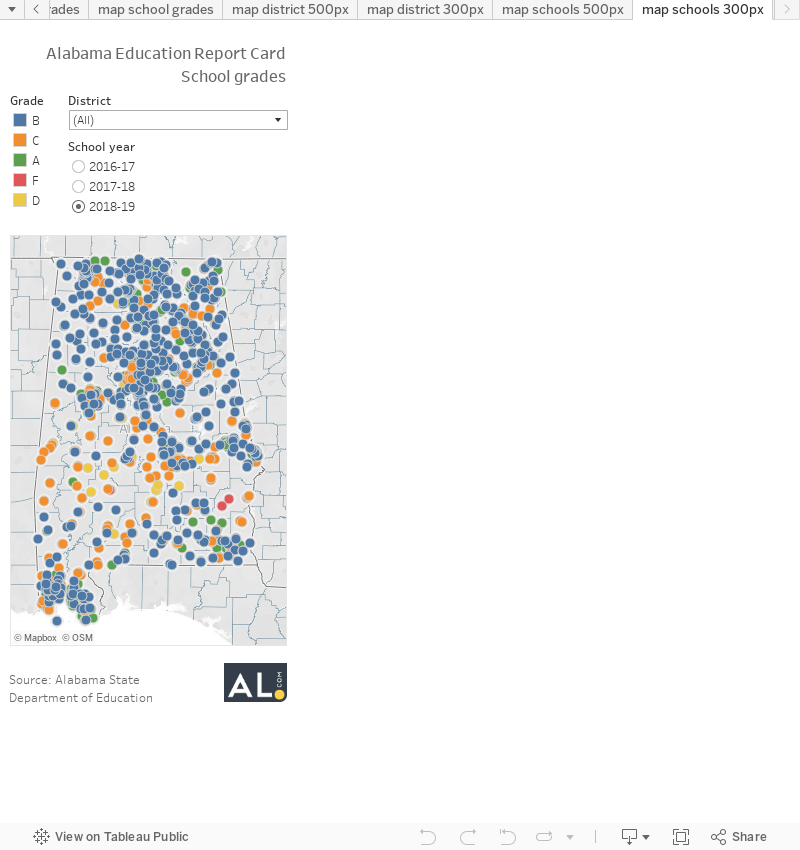
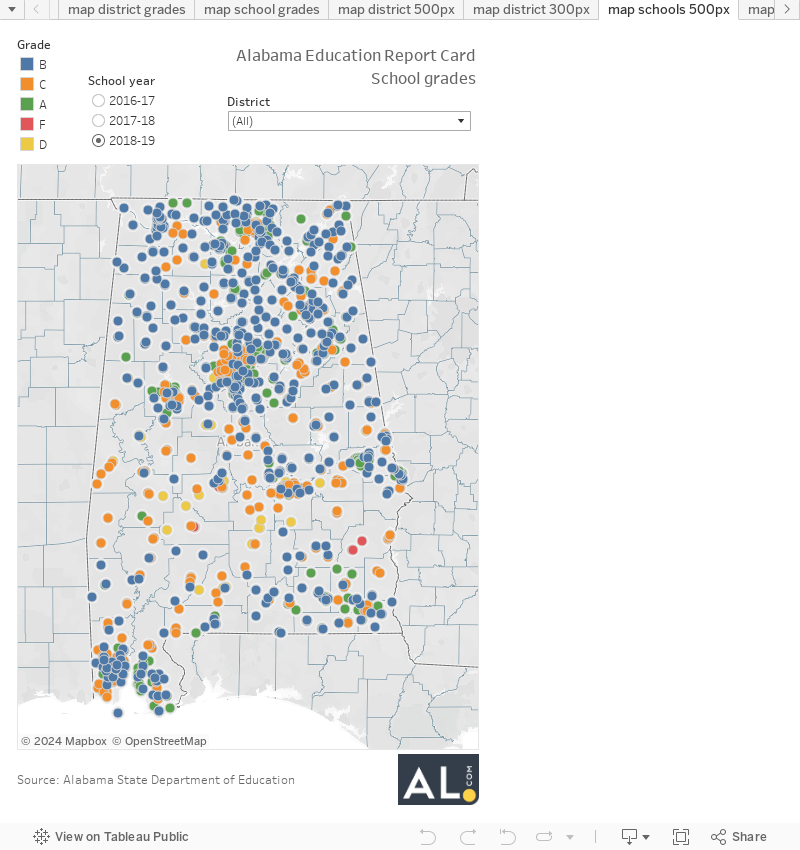
Here’s a look at grades for schools statewide. Each dot represents a school. Hover over a dot for more information about the school. Narrow down the view by clicking on the letter grade in the legend. Choose a system to narrow further.
As always, the map is best viewed on a larger screen. Click here if you are unable to see the map below.
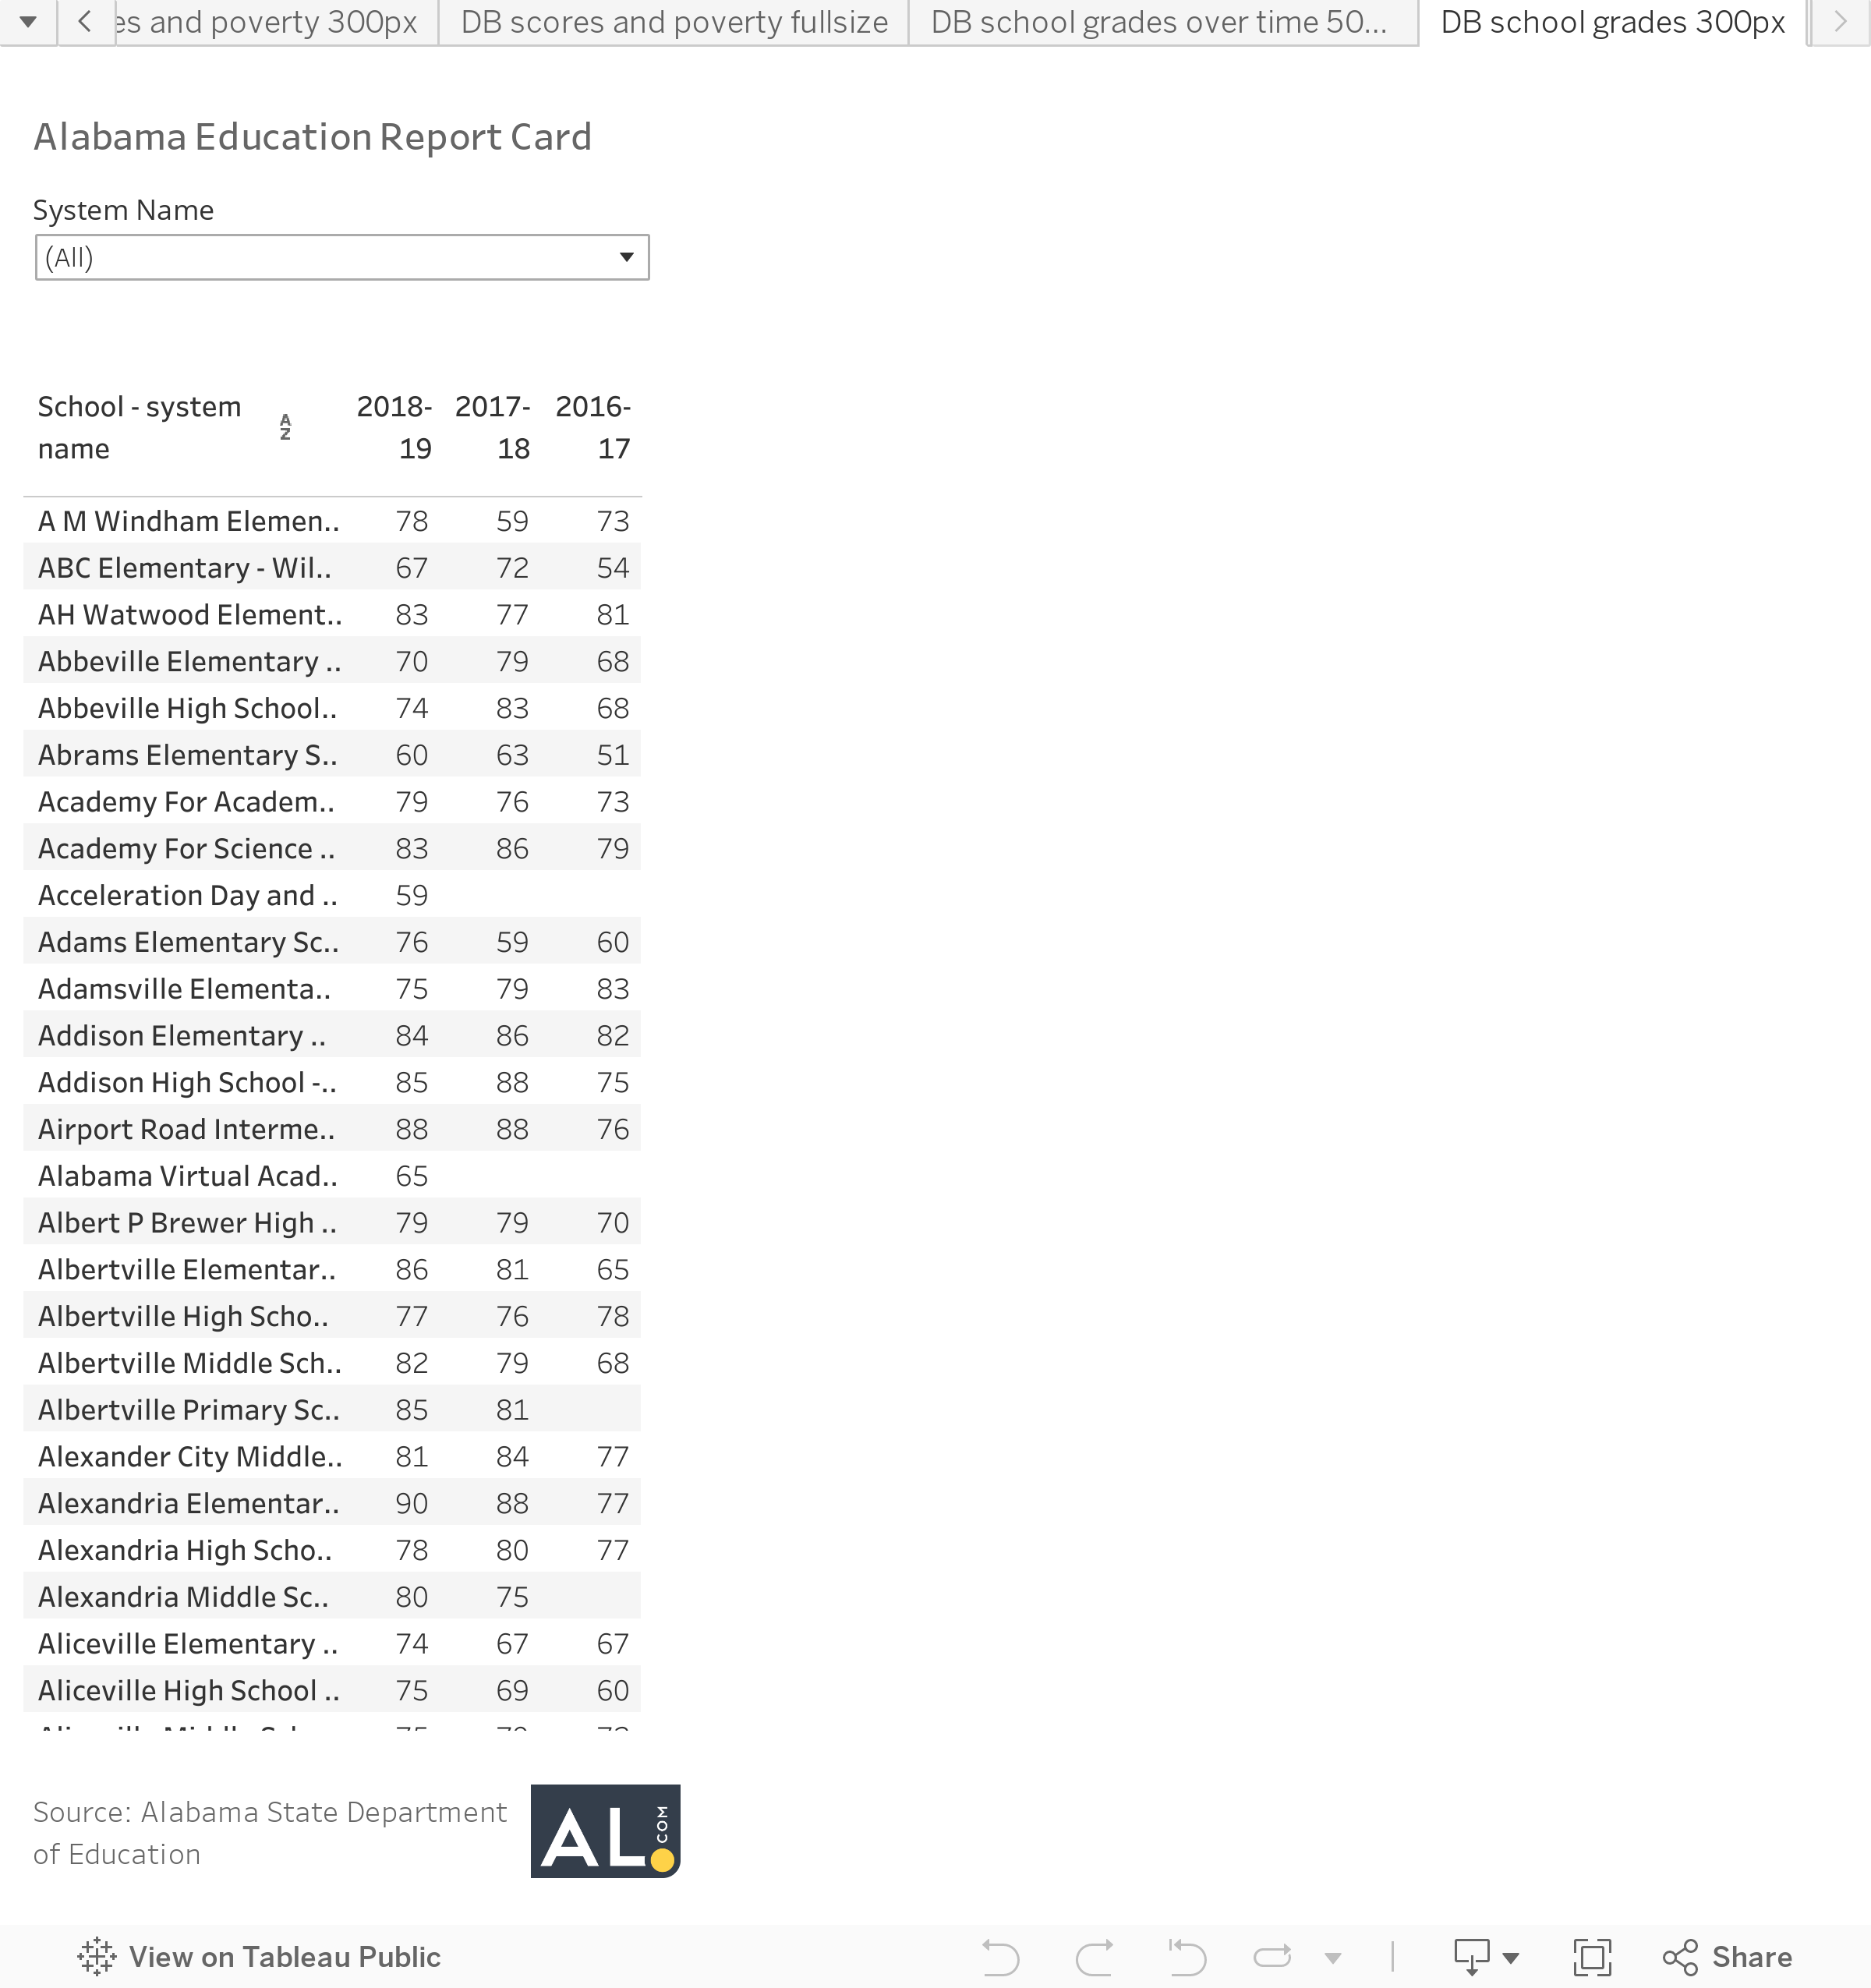
Here’s a way to find the 2018-19 score for every school. The grade a school is assigned is on a typical 100-point scale. The school name is listed first, and you can narrow down the view by system.
Click here if you are unable to see the list below.
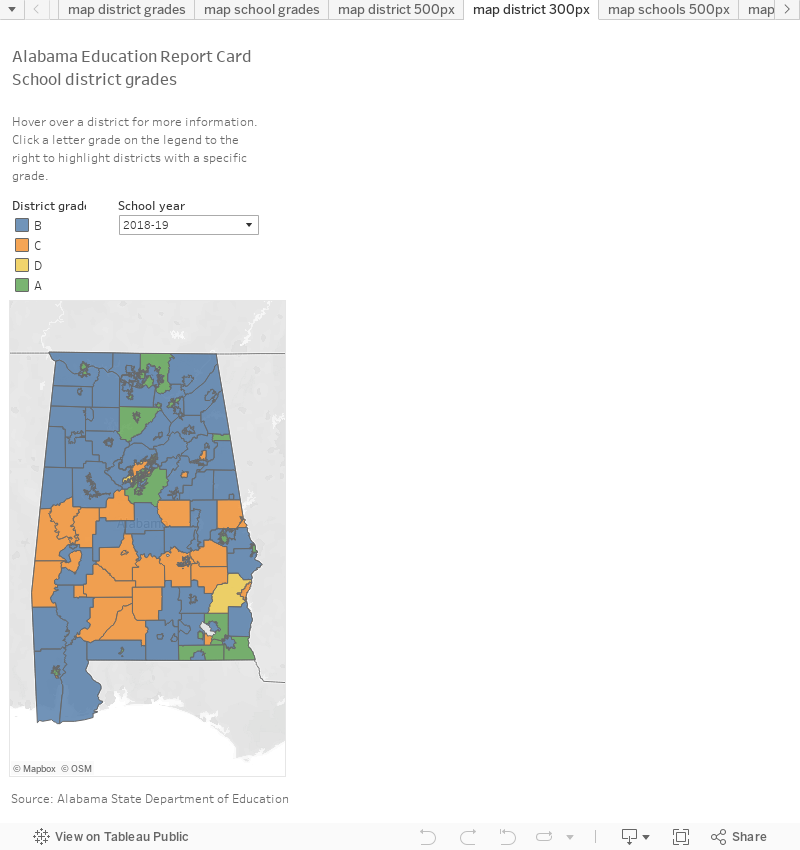
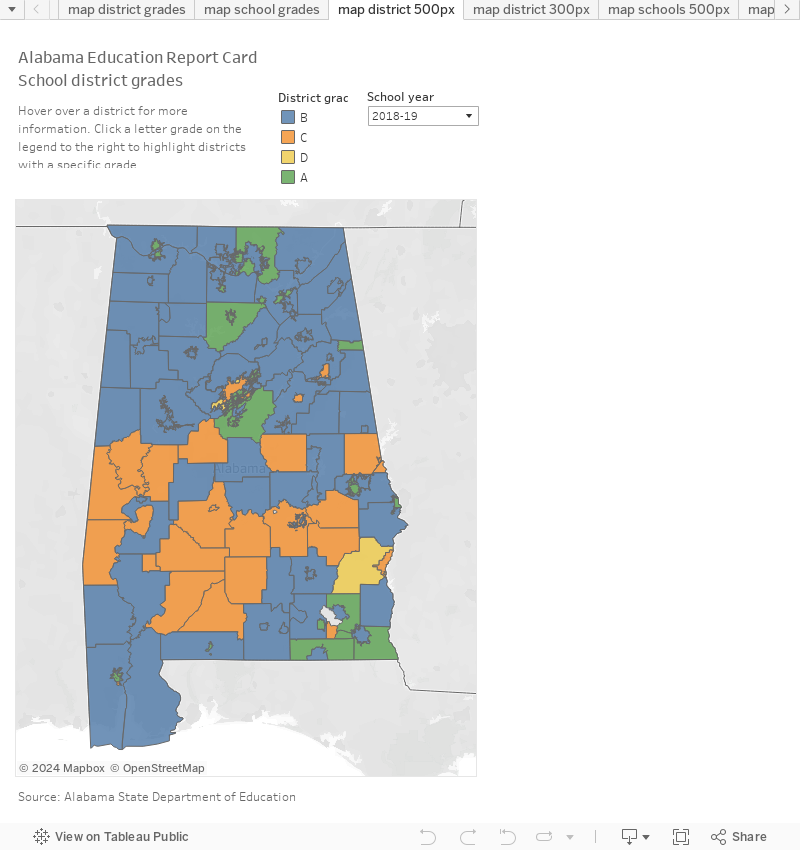
District grades
Districts are graded, too, and those grades soared, with nearly double the number of districts earning A’s this year compared to last year. City school districts still outpace county districts, as all but five of the 26 'A' districts were in cities.
Overall, here’s what district grades look like:
- 26 A’s, up from 15 last year,
- 80 B’s, up from 70 last year,
- 29 C’s, down from 42 last year,
- 3 D’s, down from 10 last year.
Phenix City Schools earned most improved, raising their score by 12 points, from a 78 to a 90, earning an 'A' for the district. Daleville City Schools took second place in that category, raising their score 11 points, from a 68 to a 79.
No districts have earned an 'F' since grading began.
These are the 26 districts earning A’s:

These are the 26 Alabama school districts that earned an 'A' on the 2018-19 education report card.
Here’s a map of all three years of district grades. Hover over the district for more information.
Click here if you are unable to see the map below.
Charter schools and virtual schools
This is the first year Alabama’s two public charter schools have been eligible to earn grades.
The state’s first public charter school, ACCEL Academy in Mobile, earned an 'F', and state officials were quick to point out ACCEL’s mission—re-engaging students who are not on track to graduate high school or who may already have left high school—is different from traditional public schools.
Deputy State Superintendent Dr. Daniel Boyd said, "Although the state report card is an effective measure for traditional public high schools, it does not completely capture the story of ACCEL since this school serves nontraditional students."
"We remain committed to our on-track and off-track scholars by providing them with a personalized and accelerated pathway to graduation," ACCEL's superintendent Dr. Jeremiah Newell said in a press release. "We are willing to take the 59/F if it means giving our students an opportunity to succeed."
University Charter School in west Alabama earned a 'C' on its first report card grade.
Grades for statewide virtual schools showed improvement over last year when both statewide virtual schools—Limestone County Virtual Center and Conecuh County’s Genesis Innovative School—earned F’s. This year, they raised their grades to a 'D' and a ‘C,’ respectively. Alabama Virtual Academy, the state’s largest virtual school enrolling nearly 2,700 students statewide last year, earned its first grade, a 'D'.
How grades are calculated
Here’s a look at how those measures are weighted in district grades and in school with a 12th grade.

These are the weights given to each indicator on the statewide Alabama education report card.
Schools without a 12th grade won't have graduation or college and career readiness rates, so academic achievement and growth are weighted equally at 40%, and the absenteeism measure grows to 15% of the total score.
Academic achievement
The academic achievement indicator reflects the test results for students in grades 3 through 8 in math and reading, and in grades 5 and 7 in science.
The Scantron test was used for this year's results, but a new test, the Alabama Comprehensive Assessment Program, or ACAP, will be given to students in grades 2 through 8 in math and reading and in grades 4, 6, and 8 in science. The second-grade scores will be used to measure growth and will not be publicly reported.
At the high school level, the ACT college entrance exam, given to all 11th graders, is used as the achievement measure. Three parts of the ACT---English, math, and science---are used in the calculation.
The numerical score indicates points earned, not percentage of students who reached proficiency. Scores for the achievement and growth indicators are weighted, meaning high-scorers earn a school extra points.
For example, on the achievement indicator, students at the highest level, Level 4, earn the school 1.25 points. Students at Level 3, meaning the student reached the proficient level, earn 1 point. Students at Level 2, those that are close to proficiency, earn 0.5 points toward the total.
Academic growth
The academic growth measure reflects the improvement students in grades 3 through 8 made on tests taken at the beginning compared to tests taken at the end of the school year. Teachers generally see growth as a fairer measure of their impact on student learning.
The growth measure is also weighted, meaning additional points are given for high growth, so a high score doesn't mean all students showed great improvement. The breakdown for how many students grew at which rates is not provided by the state department.
Graduation rates, college- and career-readiness rates
Two additional measures on the state report card are graduation rate and college- and career-readiness rate. Those measures are only calculated for schools with a 12th grade.
Graduation rates are based on four-year-cohorts, meaning the percentage of students who graduate four years after entering high school as a ninth-grader.
Education officials have stressed that the graduation rate and the college- and career-readiness rate for a school should be similar, showing that students who graduate from high school have accomplished one of seven college and career readiness indicators:
- Earning a benchmark score in any subject area on the ACT college entrance exam,
- Earning a qualifying score of 3 or higher on an Advanced Placement (AP) exam,
- Earning a qualifying score of 4 or higher on an International Baccalaureate (IB) exam,
- Earning college credit while in high school,
- Earning a silver or gold level on the ACT WorkKeys exam,
- Earning a career technical industry credential, or
- Being accepted into the military.
Chronic absenteeism
The chronic absenteeism measure changed from the percentage of students missing 15 or more days to those missing 18 or more days of school in an academic year, a more standard measure nationwide.
That percentage dropped from more than 18 percent in the 2017-18 school year to just over 11 percent last year.
Whether that’s a direct result of the change in the number of days or a change in the way an absence is recorded isn’t known, but it’s headed in the right direction according to state officials.
State officials earlier this year clarified what should be considered an absence after chronic absenteeism rates climbed last year.
Progress in English language proficiency
In schools where there are at least 20 students learning the English language in tested grades, five percent of a school’s or district’s score will be calculated from student progress. Schools without that measure will be more heavily weighted on other measures.
A complete look at how each indicator was calculated is on the state department’s web site.
Alabama lawmakers first passed the law requiring the use of letter grades for school and district report cards in 2012. For reasons including a change in which test was being used, the first round of report cards wasn’t released until December 2016.
The federal Every Student Succeeds Act also requires states to publish school and district report cards, but gave states flexibility in whether to use letter grades or some other measuring system.
Update: this site was updated multiple times Friday morning to correct numerical errors. We apologize for the errors.
2:00 p.m. Gov. Kay Ivey’s remarks were added and the official Education Report Card website address was updated to a newer link.