
SHELBY COUNTY, Tennessee —
There are more troubling trends as we follow the data on the COVID-19 pandemic. Our goal every night is to give you some context on the impact coronavirus is having on our community. We don't want to just throw out a bunch of numbers without giving you that perspective. We want to take a closer look at the numbers.
Our first graphic Wednesday night is new hospitalizations in Shelby County. If you go back a week or so you see we've had over 100 cases six out of the past seven days. That's not good at all either and look at the effect that's having on our 14-day moving average. For most of the pandemic, it's been pretty flat, but not now. It's heading up quite a bit. These are folks very sick with the virus, enough that their doctor has checked them into a local hospital.
Taking a closer look you can see we'd been holding on at new admissions in the single digits for several days, but Wednesday that number nearly tripled from the day before to 16 patients hospitalized, and when you go back a week or so there were some bigger numbers there as high as 27 less than a week ago, so this is concerning.
As is our next set of numbers here: these are new cases. In blue are numbers before the lockdown was lifted, in orange the numbers since then. You see we're back over 100 again, 115.
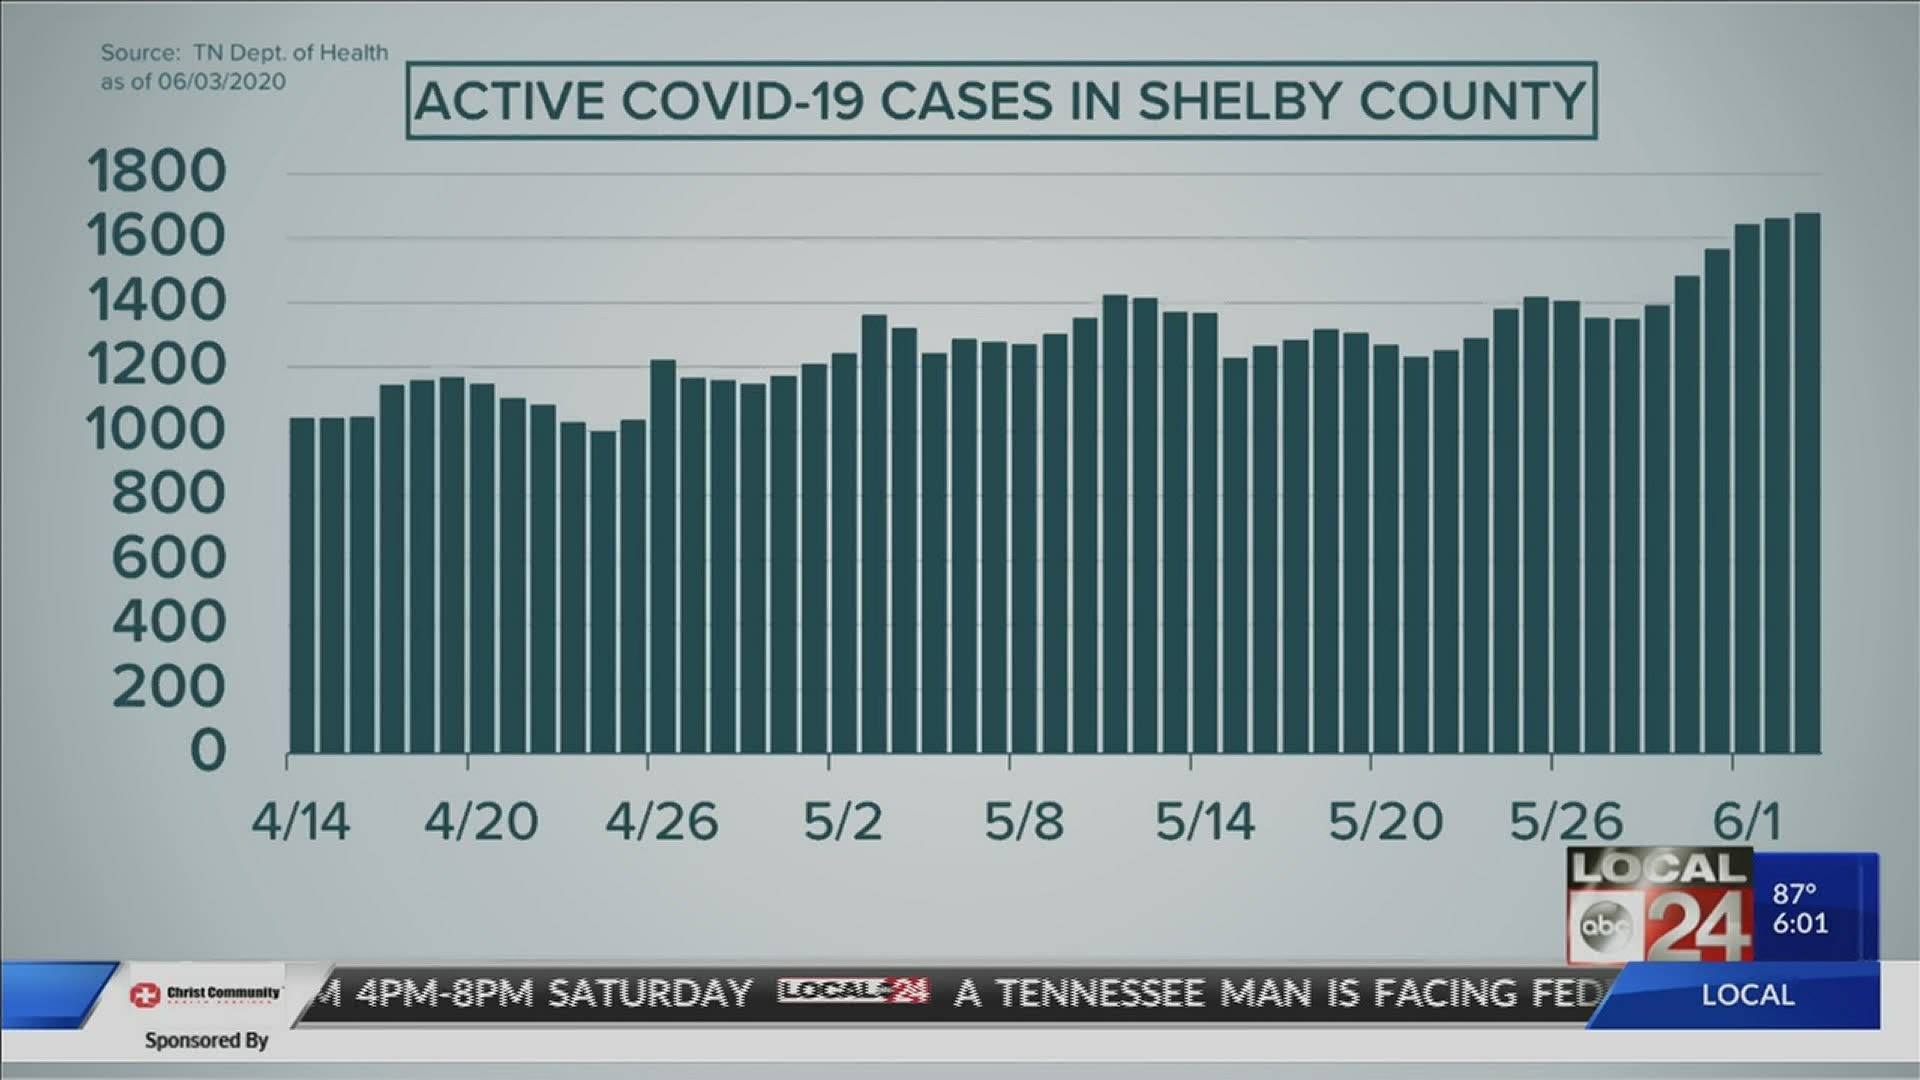
Now to active cases in Shelby County. This graphic goes all the way back to mid-April, and you can see --with a couple of exceptions-- you never had more than 1,400 patients fighting COVID-19 on a given day whether at home or the hospital, but not now. Take a look: starting about May 29th, a steady increase every day, to where right now we have nearly 1,700 patients trying to fight off this awful disease.
Finally, let's look at the positivity rate for Shelby County. This shows you of all the people who were tested for coronavirus how many people tested positive. iIn green is the percentage of total cases since testing began, in orange is the percentage of positive cases each day, This was our "graph of hope" Tuesday night, but Wednesday night that orange line is trending up and about to hit the green line at 8%.
So, if Mayor Strickland was looking for further justification on his decision Tuesday to delay phase three of the "back to business” plan, this is it. All the data now is going in the wrong direction, and in some cases the worst since we've been tracking the numbers.
We spoke by phone with Dr. David Rubin in Philadelphia. He's the director of the PolicyLab for the Children's Hospital of Philadelphia. He and his team not only are looking at this data, but they also are trying to model based on our social distancing behavior, where we're headed.