Caesars bankruptcy main contributor of 2018 casinos’ net loss


The big headline that emerged from this month’s release of the state Gaming Control Board’s 2018 Gaming Abstract was that Nevada casinos lost millions of dollars in the last fiscal year.
But before anybody jumps to conclusions that a crash is near or that those parking and resort fees are ruining the Strip, remember that the Control Board’s annual report provides combined figures and that one prominent company — Caesars Entertainment Corp. — was operating under bankruptcy protection in that time frame.
So it shouldn’t be that shocking to learn that from July 1, 2017, to June 30, 2018, 289 Nevada casinos that annually gross over $1 million in gaming revenue lost a total of $1.168 billion.
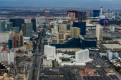
What’s most telling is that the Las Vegas Strip market, which includes 45 licensees, generated $1.697 billion in losses, meaning just about everybody else was in the black for the year. The Boulder Strip showed income of $167.6 million, while downtown Las Vegas showed $115.4 million.
Only one other market statewide, South Shore Lake Tahoe, showed a loss, which demonstrates, once again, how important that 4-mile stretch of neon is to the state’s economy.
The Strip loss was a dramatic contrast to the abstract’s 2017 numbers, which showed net income nearly tripling from the previous year to $814 million.
The abstract is a wealth of statistical information that shows net income, money spent by patrons on gaming, rooms, food, beverages and other attractions by county and by the board’s 13 geographic market areas statewide.
The report shows gaming revenue — everything brought in from slot machines, table games and the race and sports books — as well as total revenue, which includes rooms, food and beverage, and entertainment. The report also totals the average number of employees, room occupancy rates, revenue per room, and revenue per square foot of casino floor space.
What it doesn’t do is break down figures by property, thus protecting the proprietary information of privately held companies.
But the abstract does list the 15 publicly held corporations that operated 61 properties within the time frame of the report. In the 2018 fiscal year, the 61 properties accounted for 76.2 percent of the total gaming revenue generated statewide during the fiscal year.
Net income and revenue from public companies are routinely reported quarterly and as most stock-watchers know, we’re currently in the midst of the 2018 fourth-quarter earnings season.
Some key takeaways from this year’s gaming abstract:
■ Statewide, $11.596 billion in gaming revenue was generated by 289 licensees. That’s 4.4 percent ahead of the previous year and 42.8 percent of the total revenue of $27.108 billion collected, which was 3.6 percent more than the previous year. Casinos paid $874.4 million, or 7.5 percent, in gaming taxes and fees.
■ In Clark County, $9.984 billion in gaming revenue was generated by 168 licensees. That’s 4.1 percent ahead of the previous year and 41.2 percent of the total revenue of $24.231 billion collected, which was 3.2 percent more than the previous year.
■ On the Strip, $6.288 billion in gaming revenue was generated by 45 licensees. That’s 4.1 percent ahead of the previous year and 34.3 percent of the total revenue of $18.308 billion collected, which was 3.1 percent more than the previous year. That really shows how Strip rooms and amenities have become far more important to properties than the gaming floor.
■ In downtown Las Vegas, 17 licensees generated $633.1 million in gaming revenue. That’s 3.2 percent ahead of the previous year and 50.2 percent of the total revenue of $1.261 billion collected, which was 2.7 percent more than the previous year. Clearly, it’s more about the gambling than the amenities downtown.
■ The Strip room occupancy rate for the year was 91.4 percent, with July the highest (96.8 percent) and December the lowest (80.2 percent). Downtown, the overall rate was 87.4 percent with March the highest (92.6 percent) and December the lowest (77.7 percent).
■ On the Strip, the average daily room rate was $174.01, average daily slot revenue per machine per day was $113.58 and average table revenue (including bingo and keno) was $92.40 per room, per day. Downtown, the room rate was $77.49, slot revenue was $138.39 and table revenue was $46.63.
Contact Richard N. Velotta at rvelotta@reviewjournal.com or 702-477-3893. Follow @RickVelotta on Twitter.