Las Vegas among cheapest places to live for millennials


Whether you’re fresh out of college or about a decade into your career, it never hurts to save more money — especially if you’re looking to get ahead of the game and retire earlier. One way you can keep more money in your bank account is to live in one of the best cities for millennials. Not only are these cities some of the cheapest places to live, but they also feature larger numbers of residents ages 25 to 39.
To determine the 50 most affordable cities for millennials, GOBankingRates analyzed over 700 cities with at least 50,000 residents and a millennial population of 21.6% or greater. Factors included the three-year change in each city’s millennial population, the overall cost-of living index, the median monthly rent and the median home list price.
Saving money in a cheaper city doesn’t have to be boring. For example, the place with the largest percentage of millennials on GOBankingRates’ list is one of southeast Michigan’s trendiest cities.
50. Bryan, Texas
- Percentage of millennial residents in 2017: 25.1%
- 3-year change in millennial population: 0.7%
- Median monthly rent: $1,285
- Median list price: $224,900
Bryan has a cost of living that’s 11.5% below the national average — and the millennial population in the city is slowly increasing. In 2014, the percentage of millennial residents in Bryan was 24.4%, which is 0.7 percentage points lower compared to 2017. Additionally, the city’s median monthly rent is $201 below the national average of $1,486. The median list price for a home also comes in below the national average of $289,900.
49. Temple, Texas
- Percentage of millennial residents in 2017: 22.1%
- 3-year change in millennial population: 0.9%
- Median monthly rent: $1,116
- Median list price: $189,850
Temple has the 10th-most affordable cost-of-living expenses at 16.7% below the national average. The monthly median rent in this city is $370 below the national average of $1,486. However, homebuying is where millennials can really save. The median list price in Temple is approximately $100,000 less than the national average of $289,900.
48. Lawton, Oklahoma
- Percentage of millennial residents in 2017: 23.9%
- 3-year change in millennial population: -0.4%
- Median monthly rent: $723
- Median list price: $99,900
If you’re trying to save money on expenses, Lawton could be one of the best cities to live in due to its affordable cost of living, which is 21.6% below the national average. The city’s affordability can be partially attributed to Lawton having the lowest median rent of all the cities on GOBankingRates’ list, at $723 per month. The city also has the third-lowest median list price at $99,900, which comes in at $190,000 below the national average.
47. Oklahoma City
- Percentage of millennial residents in 2017: 23.1%
- 3-year change in millennial population: 0%
- Median monthly rent: $1,100
- Median list price: $189,900
Oklahoma City has a cost of living that’s 8.5% below the national average. Millennials interested in buying a home in this city are in luck: Oklahoma City’s median home list price is exactly $100,000 under the national average. For those who choose to rent, the median monthly rent in Oklahoma City is $386 cheaper than the national average. The city also ranks No. 6 for three-year total population growth.
46. Des Moines, Iowa
- Percentage of millennial residents in 2017: 23.3%
- 3-year change in millennial population: 0.3%
- Median monthly rent: $1,164
- Median list price: $147,500
In Des Moines, the cost of living is 14.1% below the national average. Millennial homebuyers can celebrate in this city: The median list price for a home is $142,400 less than the national average. However, the millennial population in Des Moines has some room to grow. The three-year change is a bit less than the national average of 0.4%.
45. Kansas City, Missouri
- Percentage of millennial residents in 2017: 24.1%
- 3-year change in millennial population: 0.7%
- Median monthly rent: $1,150
- Median list price: $210,000
Kansas City has a cost of living that’s 8.1% below the national average. The three-year growth in the millennial population is greater than the national average of 0.4%. The percentage of millennial-aged residents in 2014 and 2017 — 23.4% and 24.1%, respectively — are also above the national averages of 19.7% and 20.1%. Overall, Kansas City rounds out the top 10 cities with the largest three-year change in total population growth.
44. Spokane Valley, Washington
- Percentage of millennial residents in 2017: 22.9%
- 3-year change in millennial population: 2.7%
- Median monthly rent: $1,405
- Median list price: $265,950
Spokane Valley has a cost of living that’s 2.2% higher than the national average. The city also ranks No. 3 for the largest three-year change in the millennial population at 2.7%. In 2014, Spokane Valley had 18,347 millennial residents, whereas in 2017, the number of millennial residents in the city increased to 21,601.
43. Memphis, Tennessee
- Percentage of millennial residents in 2017: 22.2%
- 3-year change in millennial population: 0.4%
- Median monthly rent: $866
- Median list price: $105,000
Memphis has a cost of living that’s 15.7% below the national average. The city’s median monthly rent of $866 is the seventh cheapest on GOBankingRates’ list, and the median home list price of $105,000 is the fifth lowest. The three-year change in Memphis’ millennial population is on par with the national average of 0.4%.
42. Pocatello, Idaho
- Percentage of millennial residents in 2017: 23.3%
- 3-year change in millennial population: 1.2%
- Median monthly rent: $967
- Median list price: $209,900
Pocatello has a cost of living that’s 12.5% below the national average. The three-year change in Pocatello’s millennial population is three times the national average of 0.4%. In 2014, the number of millennial-aged residents in the city was 12,037, totaling 22.1% of the population. In 2017, the number increased by 1.2 percentage points for a total of 12,698 millennials.
41. Peoria, Illinois
- Percentage of millennial residents in 2017: 21.7%
- 3-year change in millennial population: 0.8%
- Median monthly rent: $902
- Median list price: $124,000
In Peoria, the cost of living is 20.7% below average. The city’s median home list price of $124,000, which is the seventh lowest on GOBankingRates’ list, definitely contributes to Peoria’s low cost of living — the national average is $289,900, which is nearly $170,000 more expensive. In addition, the three-year change in the city’s millennial population is double the national average.
40. Lancaster, Pennsylvania
- Percentage of millennial residents in 2017: 24.8%
- 3-year change in millennial population: 1.2%
- Median monthly rent: $1,151
- Median list price: $188,700
Lancaster has a cost of living that’s 7% below the national average. Even though you could score larger cost-of-living savings in some of the other cities on GOBankingRates’ list, both the median monthly rent and the median home list price in Lancaster fall below the national average. For example, the median list price is $101,200 cheaper, which makes Lancaster one of the best places to live.
39. Jackson, Mississippi
- Percentage of millennial residents in 2017: 21.9%
- 3-year change in millennial population: 1.1%
- Median monthly rent: $806
- Median list price: $133,450
Jackson has a cost of living that’s 10.7% below the national average, as well as the fourth-lowest median rent at $806 per month. In addition, the three-year change in Jackson’s millennial population is 0.7 percentage points higher than the national average, increasing from 36,115 millennials in 2014 to 37,281 millennials in 2017.
38. Austin, Texas
- Percentage of millennial residents in 2017: 30.6%
- 3-year change in millennial population: 1.1%
- Median monthly rent: $1,859
- Median list price: $400,000
The cost of living in the capital of Texas is 30% higher than the national average. However, Austin has the second-largest percentage of millennial-aged residents at 30.6%. In 2014, the city had the largest percentage of millennial-aged residents at 29.5%. Overall, between 2014 and 2017, Austin experienced the fourth-largest increase in its population of millennials — a change of 25,704 residents.
37. Bloomington, Illinois
- Percentage of millennial residents in 2017: 23.1%
- 3-year change in millennial population: 2.8%
- Median monthly rent: $950
- Median list price: $174,900
Bloomington has a cost of living that’s 10.4% below the national average. Between 2014 and 2017, the city saw the second-largest change in millennial population at 2.8%, which is seven times the national average of 0.4%. In 2014, the number of millennial residents totaled 17,283, or 20.3% of the population. In 2017, the number increased to 18,077, or 23.1% of the population.
36. Warner Robins, Georgia
- Percentage of millennial residents in 2017: 25%
- 3-year change in millennial population: -0.6%
- Median monthly rent: $951
- Median list price: $145,000
In Warner Robins, the cost of living is 14.9% below the national average. Part of the savings comes from the city’s median home list price, which is well below the national average at $144,900. In 2014, the city had the ninth-largest percentage of millennial-aged people, totaling 25.6% of the population. In 2017, the percentage of millennials decreased slightly to 25%.
35. Kansas City, Kansas
- Percentage of millennial residents in 2017: 22%
- 3-year change in millennial population: 0.5%
- Median monthly rent: $901
- Median list price: $129,000
Kansas City has a cost of living that’s 14.5% below the national average. The lower cost of living is partially due to the city’s monthly median rent of $901, which is the 10th lowest on GOBankingRates’ list and $585 cheaper than the national average. Plus, Kansas City’s median list price of $129,000 is the ninth lowest on the list and $160,900 less than the national median.
34. Conroe, Texas
- Percentage of millennial residents in 2017: 23.2%
- 3-year change in millennial population: -0.8%
- Median monthly rent: $1,588
- Median list price: $280,802
In Conroe, the cost of living is 2% above the national average. The median monthly rent in the city is $102 higher than the national average, whereas the median list price for a home is just $9,098 cheaper. But even though Conroe isn’t the cheapest city on GOBankingRates’ list, millennials are still moving there. In 2014, the number of millennial-aged people living in the city was 14,704; in 2017, the number had increased to 17,837. Conroe ranks No. 9 for the most significant three-year change in total population growth.
33. Abilene, Texas
- Percentage of millennial residents in 2017: 22.7%
- 3-year change in millennial population: 1.6%
- Median monthly rent: $1,074
- Median list price: $195,000
In Abilene, the cost of living is 16.3% below the national average. Both the median monthly rent and median home list price in the city are below the national averages of $1,486 and $289,900, respectively. Additionally, the three-year change in Abilene’s millennial population is four times the national average of 0.4%.
32. North Charleston, South Carolina
- Percentage of millennial residents in 2017: 26.1%
- 3-year change in millennial population: 0.8%
- Median monthly rent: $1,366
- Median list price: $210,000
In North Charleston, the cost of living is 4.1% above the national average, but that hasn’t stopped millennials from settling in the city. The growth in North Charleston’s millennial population between 2014 and 2017 is double the national average of 0.4%. Plus, housing costs are still below the national averages of $1,486 for median monthly rent and $289,900 for median home list price.
31. San Angelo, Texas
- Percentage of millennial residents in 2017: 22.3%
- 3-year change in millennial population: 2%
- Median monthly rent: $1,201
- Median list price: $194,900
San Angelo has a cost of living that’s 12% below the national average. Both the median monthly rent and median list price for a home are below the national averages of $1,486 and $289,900, respectively. Also, San Angelo has the eighth-largest three-year change in millennial population at 2%. In 2014, the number of millennial-aged residents in the city was 19,524, whereas in 2017, the number had increased to 22,095.
30. Baltimore
- Percentage of millennial residents in 2017: 25.4%
- 3-year change in millennial population: 1.7%
- Median monthly rent: $1,289
- Median list price: $169,900
In Baltimore, the cost of living is 3.2% below the national average. The median monthly rent is $197 cheaper than the national average of $1,486, and the median list price for a home is $120,000 less than the national average of $289,900. Of all the places on GOBankingRates’ list, Baltimore saw the seventh-largest increase in the number of millennial residents between 2014 and 2017 — a change of 9,666 people from this age group.
29. Greenville, South Carolina
- Percentage of millennial residents in 2017: 26.3%
- 3-year change in millennial population: 1.4%
- Median monthly rent: $1,309
- Median list price: $284,900
Greenville has a cost of living that’s 4.7% below the national average. However, the median monthly rent in the city is only $177 cheaper than the national average, and the median home list price is just $5,000 less than the national average. At the same time, the three-year change in Greenville’s millennial population is more than three times the national average of 0.4%.
28. Savannah, Georgia
- Percentage of millennial residents in 2017: 24%
- 3-year change in millennial population: 1.7%
- Median monthly rent: $1,173
- Median list price: $230,000
Savannah has a cost of living that’s 12.1% below the national average, and the three-year change in the city’s millennial population is more than four times the national average of 0.4%. In 2014, the number of millennial-aged people in Savannah was 31,509, or 22.3% of the population. In 2017, the number of people in this age group had increased to 34,671, or 24% of the population.
27. Grand Rapids, Michigan
- Percentage of millennial residents in 2017: 25.3%
- 3-year change in millennial population: 1.4%
- Median monthly rent: $1,304
- Median list price: $170,000
In Grand Rapids, the cost of living is 7.3% below the national average. Residents should keep in mind that you can get a better deal if you buy instead of rent. The median monthly rent in the city is $1,304, which is only $182 cheaper than the national average. The median list price of a home, however, is a whopping $119,900 less than the national average.
26. North Little Rock, Arkansas
- Percentage of millennial residents in 2017: 23.2%
- 3-year change in millennial population: 0.4%
- Median monthly rent: $858
- Median list price: $129,500
In North Little Rock, the cost of living ranks as the fifth-most affordable in America, totaling 19.3% below the national average. The lower cost of living can be partially attributed to the fact that North Little Rock has the fifth-lowest median monthly rent at $858, which is $628 cheaper than the national average. The city also has the 10th-lowest median home list price at $129,500.
25. Columbus, Georgia
- Percentage of millennial residents in 2017: 22.7%
- 3-year change in millennial population: 0.8%
- Median monthly rent: $859
- Median list price: $115,000
Columbus has the second-most affordable cost of living — it’s 21.5% cheaper than the national average. These figures can help explain why: The city has the sixth-lowest median monthly rent at $859, which is $627 less than the national median, as well as the seventh-lowest median home list price at $115,000, which is a staggering $174,900 less than the national average. The three-year change in Columbus’ millennial population is double the national average, so millennials moving to the city probably appreciate these prices.
24. Midwest City, Oklahoma
- Percentage of millennial residents in 2017: 22.4%
- 3-year change in millennial population: 1.2%
- Median monthly rent: $889
- Median list price: $151,258
The cost of living in Midwest City is 13.8% below the national average. The city has the eighth-lowest median monthly rent at $889, as well as a median home list price that’s $138,642 below the national median. Millennials seem to like what Midwest City has to offer: The three-year change in the city’s millennial population is three times the national average of 0.4%.
23. Philadelphia
- Percentage of millennial residents in 2017: 25%
- 3-year change in millennial population: 1.5%
- Median monthly rent: $1,257
- Median list price: $235,000
Even though Philadelphia has a cost of living that’s 10.8% above the national average, it still ranks as one of the best cities for young professionals. The median monthly rent is $229 cheaper than the national average, and the median home list price is $54,900 lower. Overall, Philadelphia experienced the third-largest increase in the population of millennials between 2014 and 2017 — a change of 27,646 residents — as well as the seventh-largest increase in terms of the total population.
22. Royal Oak, Michigan
- Percentage of millennial residents in 2017: 30.9%
- 3-year change in millennial population: 2.6%
- Median monthly rent: $1,686
- Median list price: $284,995
Royal Oak has the largest percentage of millennial-aged residents on GOBankingRates’ list, at 30.9% of the population. In 2014, the city had the third-largest percentage of people in this age group, at 28.3% of the population. Between 2014 and 2017, Royal Oak experienced the fourth-largest change in millennial population. Additionally, the cost of living in this city is 13.5% above the national average.
21. Rochester, New York
- Percentage of millennial residents in 2017: 24.9%
- 3-year change in millennial population: 1%
- Median monthly rent: $1,123
- Median list price: $79,900
Rochester has the eighth-most affordable cost of living at 17.5% below the national average. Median monthly rent is $363 cheaper than the national average of $1,486, and Rochester also has the lowest median home list price of all cities on GOBankingRates’ list, at $79,900. The three-year change in the city’s millennial population is 2 1/2 times the national average of 0.4%.
20. Houston
- Percentage of millennial residents in 2017: 25.5%
- 3-year change in millennial population: 0.4%
- Median monthly rent: $1,457
- Median list price: $300,000
Although Houston has a cost of living that exceeds the national average by 4.8%, the city experienced the biggest change in millennial population — an increase of 34,464 residents — between 2014 and 2017. Houston also ranks No. 1 for change in total population. The city’s higher cost of living is partially reflected in its median home list price of $300,000, which is $10,100 above the national average. However, the median monthly rent in Houston is slightly below the national average of $1,486.
19. San Marcos, Texas
- Percentage of millennial residents in 2017: 22.3%
- 3-year change in millennial population: 1.7%
- Median monthly rent: $1,457
- Median list price: $274,995
San Marcos has a cost of living that’s 4.2% above the national average. Even so, the change in the city’s millennial population between 2014 and 2017 was over four times the national average of 0.4%. In 2014, there were 10,566 millennials living in the city, whereas in 2017, the number had increased to 13,342. Both the median monthly rent and median home list price in San Marcos fall below the national averages of $1,486 and $289,900, respectively.
18. San Antonio
- Percentage of millennial residents in 2017: 22.8%
- 3-year change in millennial population: 0.8%
- Median monthly rent: $1,316
- Median list price: $245,000
In San Antonio, the cost of living is 3.3% below the national average. Overall, the city experienced the second-largest change in the millennial population between 2014 and 2017 — an increase of 28,549 residents. In 2014, the number of millennials in the city totaled 304,796, whereas in 2017, the number had increased to 333,345. In addition, San Antonio ranks No. 2 on GOBankingRates’ list for total population growth.
17. Augusta, Georgia
- Percentage of millennial residents in 2017: 22.4%
- 3-year change in millennial population: 1.2%
- Median monthly rent: $743
- Median list price: $129,900
Augusta has a cost of living that’s 15% below the national average, which is partially due to the fact that the city has the second-lowest median monthly rent at $743. Plus, the median list price for a home in Augusta falls just outside of the 10 cheapest on GOBankingRates’ list — it’s $160,000 below the national median.
16. Fayetteville, North Carolina
- Percentage of millennial residents in 2017: 24.1%
- 3-year change in millennial population: 0.5%
- Median monthly rent: $899
- Median list price: $160,000
Fayetteville has a cost of living that’s 13.4% below the national average. The city has the ninth-lowest median monthly rent at $889, and its median home list price is $129,900 cheaper than the national average. The three-year change in Fayetteville’s millennial population is slightly above the national average of 0.4%. In 2014, there were 47,771 millennial-aged residents in the city, whereas in 2017, the number had increased to 50,762.
15. Buffalo, New York
- Percentage of millennial residents in 2017: 23.2%
- 3-year change in millennial population: 1.7%
- Median monthly rent: $1,038
- Median list price: $108,000
Buffalo has the seventh-most affordable cost of living at 18% under the national average. It’s easy to see why: The city’s median home list price of $108,000 is the sixth lowest on GOBankingRates’ list, at a whopping $181,900 below the national average. Additionally, the three-year change in Buffalo’s millennial population is more than four times the national average. In 2014, there were 55,891 millennial-aged residents in the city. In 2017, the number had increased to 60,499.
14. St. Louis
- Percentage of millennial residents in 2017: 26.8%
- 3-year change in millennial population: 1.3%
- Median monthly rent: $1,017
- Median list price: $159,900
In St. Louis, the cost of living is 11.3% below the national average, which is partially due to cheap housing costs in the city. The median monthly rent in St. Louis is $469 under the national average of $1,486, and the median home list price is $130,000 below the national average of $289,900. In 2014, St. Louis had the 10th-largest number of millennial-aged residents, at 25.5% of the population. In 2017, the city’s ranking in this category slipped slightly to No. 11.
13. Lakewood, Ohio
- Percentage of millennial residents in 2017: 29.9%
- 3-year change in millennial population: 1.7%
- Median monthly rent: $1,341
- Median list price: $191,200
Lakewood has the fourth-largest percentage of millennial-aged residents, at 29.9% of the population. In 2014, the city had the fifth-largest millennial population at 28.2%, which tied with Orlando, Florida. Between 2014 and 2017, Lakewood experienced the 10th-largest growth in millennial population. In addition, the cost of living in this city is 3.8% below the national average.
12. Richmond, Virginia
- Percentage of millennial residents in 2017: 27%
- 3-year change in millennial population: 2%
- Median monthly rent: $1,299
- Median list price: $269,900
Richmond has the ninth-largest percentage of millennial-aged residents and saw the seventh-largest growth in millennial population between 2014 and 2017. Although the city has a cost of living that’s 2.5% above the national average, both its median monthly rent and median list price for a home are below the national averages.
11. Lansing, Michigan
- Percentage of millennial residents in 2017: 24.2%
- 3-year change in millennial population: 1.1%
- Median monthly rent: $963
- Median list price: $89,900
Lansing has the sixth-most affordable cost of living on GOBankingRates’ list — it’s 18.4% below the national average. The city has the second-lowest median home list price at $89,900, which is a staggering $200,000 below the national average. And, Lansing’s median monthly rent is $523 cheaper. Additionally, the city’s millennial-aged population was 26,422 in 2014 and grew to 27,921 in 2017.
10. Lafayette, Indiana
- Percentage of millennial residents in 2017: 25.6%
- 3-year change in millennial population: 0.9%
- Median monthly rent: $988
- Median list price: $165,000
In Lafayette, the cost of living is 16.5% below the national average. Both the median monthly rent and median home list price in this city are well below the national averages of $1,486 and $289,900, respectively. In addition, the three-year change in Lafayette’s millennial population is more than twice the national average of 0.4%.
9. Pittsburgh
- Percentage of millennial residents in 2017: 26.6%
- 3-year change in millennial population: 2.4%
- Median monthly rent: $1,163
- Median list price: $224,400
Pittsburgh has a cost of living that’s 5.8% below the national average. The city saw the fifth-largest change in millennial population between 2014 and 2017 — an increase of 2.4 percentage points. In 2014, there were 74,063 millennial-aged residents in Pittsburgh, whereas in 2017, the number had increased to 80,988.
8. Birmingham, Alabama
- Percentage of millennial residents in 2017: 23.2%
- 3-year change in millennial population: 1.1%
- Median monthly rent: $773
- Median list price: $99,900
Birmingham has a cost of living that’s 20.9% below the national average — the third lowest out of all the cities on GOBankingRates’ list. The cheap cost of living is partially due to the city’s median monthly rent of $773, which is also the third lowest on the list. Birmingham has the fourth-lowest median home list price at $99,900, tied with Lawton, Oklahoma.
7. Clarksville, Tennessee
- Percentage of millennial residents in 2017: 27.4%
- 3-year change in millennial population: 1.1%
- Median monthly rent: $1,109
- Median list price: $229,000
Clarksville has the eighth-largest percentage of millennial-aged residents, at 27.4% of the population. In 2014, the city also had the eighth-largest percentage of millennials, at 26.3% of the population. The cost of living in Clarksville is 8% below the national average, which can be partially attributed to a median monthly rent and median list price that are cheaper than the national averages.
6. West Allis, Wisconsin
- Percentage of millennial residents in 2017: 26.3%
- 3-year change in millennial population: 2.3%
- Median monthly rent: $1,138
- Median list price: $157,700
West Allis has a cost of living that’s 5.6% below the national average. The median monthly rent is $348 lower than the national average, and the median home list price is $132,200 cheaper. Additionally, West Allis saw the sixth-largest change in millennial population between 2014 and 2017. In 2014, the city had 14,543 millennial-aged residents, whereas in 2017, the number had increased to 15,894.
5. Killeen, Texas
- Percentage of millennial residents in 2017: 27.7%
- 3-year change in millennial population: 0%
- Median monthly rent: $984
- Median list price: $159,908
Killeen has the sixth-largest percentage of millennial-aged residents, at 27.7% of the population. And that percentage has held steady: In 2014, the city boasted the same numbers. The cost of living in Killeen is the ninth-most affordable in America, at 17.4% below the national average. The low cost of living is partially reflected in the city’s median monthly rent and median list price, which are both cheaper than their respective national averages.
4. Orlando, Florida
- Percentage of millennial residents in 2017: 30.1%
- 3-year change in millennial population: 1.9%
- Median monthly rent: $1,449
- Median list price: $289,000
Orlando has the third-largest percentage of millennial-aged residents, at 30.1% of the population. In 2014, the city had the fourth-largest percentage of millennials, totaling 28.2% of the population. Between 2014 and 2017, Orlando experienced the ninth-largest change in millennial population — an increase of 1.9 percentage points — as well as the eighth-largest change in total population growth. Cost-of-living expenses in Orlando are 12.4% above the national average.
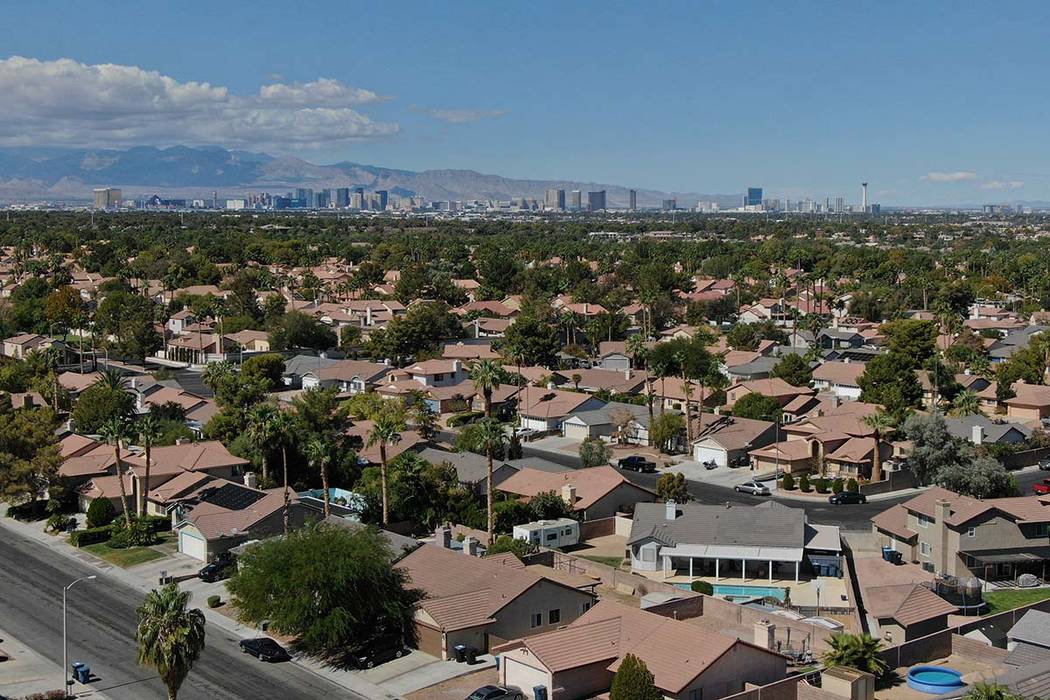
3. Southern Las Vegas, Nevada
- Percentage of millennial residents in 2017: 28.6%
- 3-year change in millennial population: -0.1%
- Median monthly rent: $1,468
- Median list price: $335,000
Even though Enterprise-area in southern Las Vegas has a cost of living that’s 26.2% above the national average, the city has the fifth-largest percentage of millennial-aged residents, at 28.6% of the population. In 2014, Enterprise had the second-largest percentage of millennial residents, at 28.7% of the population. Between 2014 and 2017, the city experienced the eighth-largest increase in the number of millennials — a change of 8,718 residents in this age group — plus the fifth-largest increase in the total population.
2. Columbus, Ohio
- Percentage of millennial residents in 2017: 27.6%
- 3-year change in millennial population: 0.9%
- Median monthly rent: $1,239
- Median list price: $189,900
Columbus has the seventh-largest percentage of millennial-aged residents, at 27.6% of the population. In 2014, the city also had the seventh-largest percentage of millennials, at 26.7% of the population. Between 2014 and 2017, Columbus experienced the fifth-largest increase in the number of millennials — a change of 18,453 residents in this age group — as well as the fourth-largest increase in total population. Additionally, the city has a cost of living that’s 9.6% below the national average.
1. Sanford, Florida
- Percentage of millennial residents in 2017: 26.9%
- 3-year change in millennial population: 4.4%
- Median monthly rent: $1,413
- Median list price: $260,998
Although Sanford has a cost of living that’s 5% above the national average, the city has the 10th-largest percentage of millennial-aged residents, at 26.9% of the population. Sanford also saw the third-largest growth in millennial population between 2014 and 2017, at 4.4%. Plus, the city’s median monthly rent and median list price come in below their respective national averages.
The Best Cities for Millennials
You might wonder why millennial-aged residents are concentrated in these 50 cities. One reason is that many of the cities on GOBankingRates’ list are college towns, and graduates often choose to make their living locally instead of moving away.
Geographically, the 50 cheapest cities for millennials are concentrated in certain areas. For example, the majority of the cities are located in Southern and Midwestern states — especially Texas, which is home to 10 cities on the list. Florida also has two cities ranking in the top 10: Sanford and Orlando, with Sanford snagging the top spot. In the West, Enterprise, Nevada, landed in the top three for the notable growth in its millennial population.
If you’re planning on relocating to one of these cities, consider the cost of renting vs. owning a home. There could be a huge cost difference that may result in significant savings over time, so it pays to be prepared.
Methodology: GOBankingRates determined the 50 cheapest places for millennials to live by analyzing over 700 U.S. cities with populations greater than 50,000 along the following criteria: (1) the percentage of the population that is millennial-aged, defined as ages 25 to 39, based on Pew Research’s definition of millennials as being ages 23 to 38 and restrictions by U.S. Census Bureau on age ranges it tracks, sourced from the 2017 American Community Survey; (2) three-year growth in millennial-aged population in absolute numbers, from 2014-17, based on ACS data; (3) three-year growth in millennial-aged population by percentage, from 2014-17, based on ACS data; (4) three-year growth in total population; (5) three-year growth in total population by percentage, based on ACS data; (6) median monthly rent, sourced from Zillow’s April 2019 index; (7) median home list price, sourced from Zillow’s April 2019 index; (8) overall cost-of-living index, based on the U.S. average of 100, sourced from Sperling’s Best Places. Each factor was scored and summed up, and then cities were ranked from best to worst. In order to qualify for the study, cities had to have greater than 21.6% of their population be millennial-aged; 21.6% is the average millennial-aged share of the population out of American cities with populations greater than 50,000.
This article originally appeared on GOBankingRates.com: 50 Cheapest Places To Live for Millennials